Dashboards Overview
Dashboards are the primary visual surface of Jet Admin. They allow you to assemble data from multiple sources into a cohesive, interactive workspace.
What is a Dashboard?
In Jet Admin's architecture, a Dashboard is a layout container. It does not store or process data itself; rather, it orchestrates a collection of Widgets (charts, tables, text) arranged on a responsive grid.
Dashboards are strictly tenant-scoped, meaning workspaces are securely isolated to the specific organization or sub-account viewing them.
Building a Dashboard
Creating a dashboard is designed to be highly interactive and code-free.
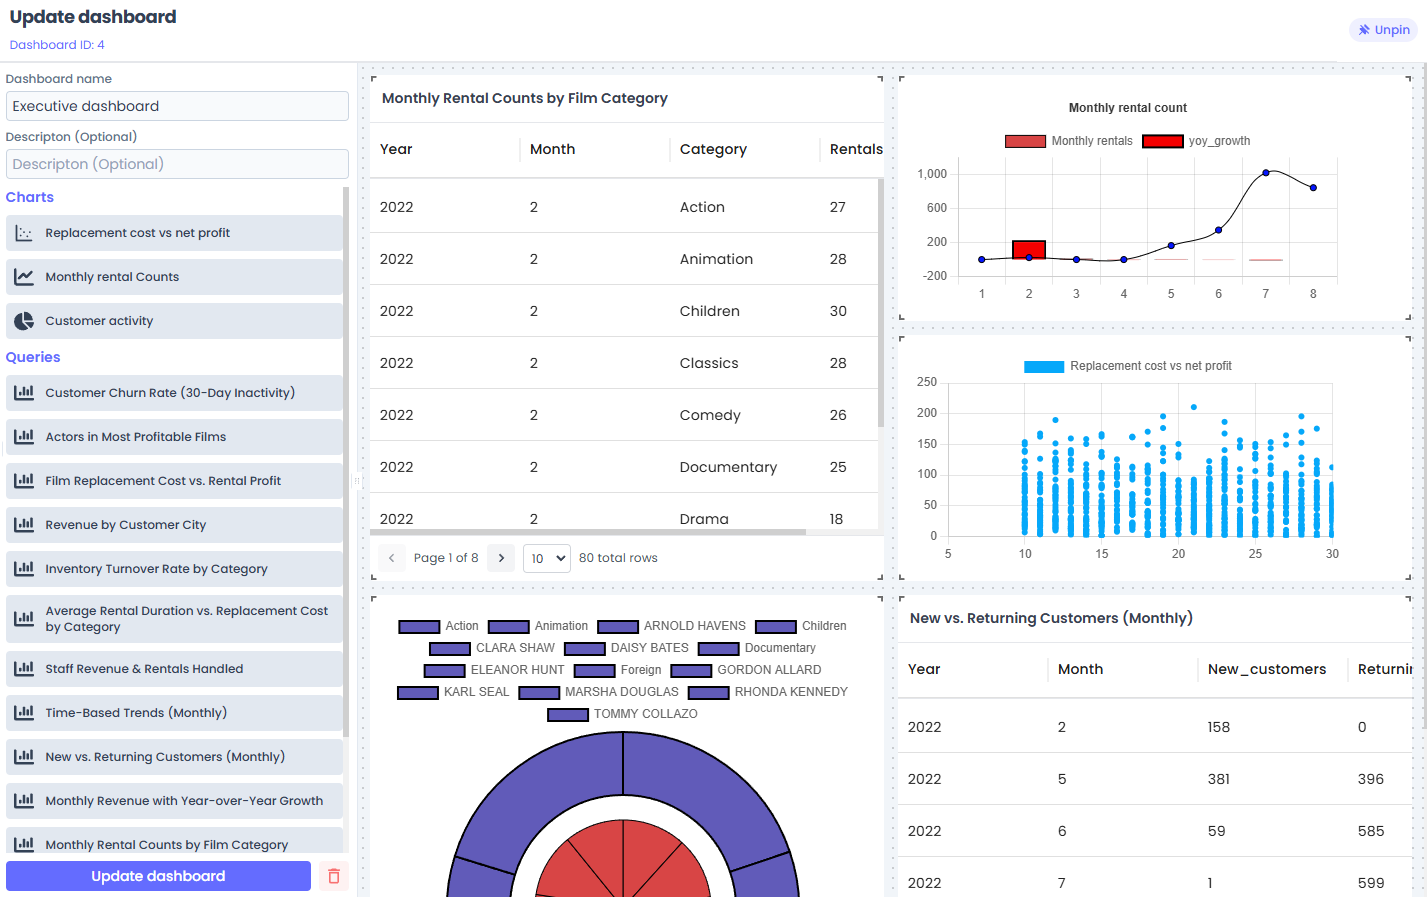
- Create: Click "New Dashboard" to generate a blank canvas.
- Add Widgets: Use the toolbox to drag and drop different Widget types (e.g., Bar Chart, Data Table) onto the canvas.
- Arrange & Resize: Jet Admin uses a responsive drag-and-drop grid system. You can resize widgets to span multiple columns or rows. The layout automatically adapts to different screen sizes (desktop, tablet, mobile).
- Configure: Click on any widget on the canvas to open its configuration panel. This is where you bind the widget to data (binding it to a Query or Workflow).
Managing Dashboards
As an admin builder, you have several tools to manage your dashboard fleet:
- Cloning: If you need to build a similar dashboard for a different team, you can "Clone" an existing dashboard. This duplicates the exact layout configuration, allowing you to modify it without starting from scratch.
- Sharing Context (Coming Soon): Dashboards will soon support URL parameters, allowing you to filter all widgets on a page dynamically based on the link accessed.
The Dashboard-Widget Relationship
To keep the platform extensible, Jet Admin separates the layout (Dashboards) from the individual components (Widgets).
- The Dashboard remembers where things are placed (e.g., Widget A is in the top left, 4 columns wide).
- The Widget remembers what it is and how to get its data (e.g., "I am a Pie Chart, and I get my data from the 'Get User Stats' workflow").
This separation allows developers to build entirely new Widget types as external plugins without modifying the core dashboard engine.
Next Steps
- Learn how to populate your dashboards by configuring Widgets.
- Understand how data flows into your UI using the Widget-Workflow Bridge.